

Canada spends roughly C$19 billion a year on research at its colleges, universities and research hospitals. For every 10,000 research papers those institutions publish, they form about 10 startups. The United States forms about 15. This is the story of where the rest of that research goes, and what is holding it back.
The Gap in Three Numbers
Canada is not short of discoveries. It ranks second in the G7 for citable research per person (Zhang, 2026b). The trouble starts when that research has to become a company or a product.
- 112 vs 941. Startups formed in 2024 by Canadian versus American institutions reporting to AUTM (Zhang, 2026b).
- About 10 vs 15. Startups per 10,000 citable research documents, Canada versus the United States, once you adjust for how much research each country produces.
- About 21 vs 86. International (PCT) patent applications per 1,000 citable documents, Canada versus the United States. Canada's rate is the lowest in the G7; Germany's is about 91.
And institutions know it. In Statistics Canada's first survey of how higher education commercializes intellectual property, 87.0% of colleges, universities and research hospitals reported at least one obstacle in 2023. Among universities, it was 95.1% (Statistics Canada, 2025b).
So the question is not whether commercialization is hard. It is which obstacles matter most, and where to start.
Six Reasons Research Stalls
To answer that, we worked backward from the outcome: publicly funded research that stalls before it reaches a licence, a spinout or the market. Using a fishbone (Ishikawa) diagram, a standard quality management tool, we sorted every documented cause into six branches. Each cause had to be backed by at least one published data point.
1. Money Runs Out Between the Grant and the Investor
Research grants pay for discovery. Investors pay for traction. Almost nothing pays for the stretch in between: prototypes, validation, and early regulatory and clinical work.
66.9% of institutions cite lack of funding as an obstacle, including 75.2% of universities and 68.9% of research hospitals (Statistics Canada, 2025b). The gap follows companies after they form: Canadian life sciences startups raise 75 to 85% less capital than their American peers (McIntyre, 2026). Among academic medical device investigators in the United States, 54% named grant funding as the hardest later stage barrier (Shah et al., 2023).
Proof of concept funds exist, but they are small and local. The University of Calgary's UCeed has invested C$9.21 million in 62 companies since 2020; the McMaster Seed Fund, C$3.5 million in 10 startups since 2021 (Crocco et al., n.d.).
2. Commercialization Is Nobody's Job
Turning research into a product competes with teaching, publishing and winning grants for faculty time, and most reward systems only count the last three.
48.9% of institutions say commercialization is not an institutional priority, rising to 61.1% of colleges and CEGEPs (Statistics Canada, 2025b). A survey of American and Canadian universities found that 75% left patents and commercialization out of tenure and promotion criteria (Stevens et al., 2011; National Academy of Inventors, 2012). And none of the three main funding streams for Canadian universities (provincial operating grants, federal research grants and tuition) is tied to commercial outcomes (Zhang, 2026b). Faculty who chase a licence or a spinout carry the career risk alone.
3. The Know How and IP Support Are Thin
50.3% of institutions cite a lack of expertise, and 59.9% of universities (Statistics Canada, 2025b). Only 48.8% have a central office managing intellectual property, and only 11.0% use IP strategists (Statistics Canada, 2025a). Technology transfer offices are often underfunded compared with their American counterparts, with staff hired on short term grants (Zhang, 2026b). Research that is never protected has little to license.
4. Inventions Leave the Lab Too Early

University inventions usually leave the lab as ideas, not products. In a study of 62 American universities, 48% of licensed inventions were only a proof of concept with no prototype, and just 12% were ready for practical use. For 71%, success still depended on the inventor staying involved (Jensen & Thursby, 2001). Backers discount that risk, which is why 43.9% of Canadian institutions cite uncertainty and risk as an obstacle (Statistics Canada, 2025b).
5. Regulation Arrives Late for Health Technology
For medical devices, the road to market runs through device classification, safety and performance testing, a quality management system and regulatory submissions. One estimate puts more than half of early device development work in regulatory processes (Rose et al., 2023).
Academic teams tend to meet these requirements late. Among 52 academic investigators building pediatric devices in the United States, 52% found regulatory and safety testing requirements hard at the early stages, 42% struggled with device classification, and 56% had never set up a quality management system (Shah et al., 2023). Support is scarce: 55% of UK universities and 35% of American universities studied offered no medical device regulatory guidance online (Hendricusdottir et al., 2021).
Canada has started to fund this gap directly. The federal Lab to Market program is putting C$4.25 million over five years into a national hub, hosted by the University of Toronto, focused on the regulatory challenges facing health and medical startups (Zou, 2025).
6. There Are Few Buyers at Home
Commercialization needs a company able to take a technology and develop it. Canada has few large research performing firms. Its leading firms invest US$3.27 in advanced industry R&D per US$1,000 of GDP, against a global average of US$11.73 and US$23.48 in the United States. Only 23 Canadian firms rank among the world's top 2,000 corporate R&D spenders (Zhang, 2026a).
So a lot of Canadian IP leaves. Of 3,164 licence and IP agreements made by ten U15 universities between fiscal 2019 and 2023, 69% went to international partners. Patented assets are the exception: about 61% of those agreements, and about 70% of exclusive rights, went to Canadian firms (AUTM Canadian Public Policy Advisory Committee, n.d.).
Two Causes Do Most of the Damage
Six branches tell you what is documented. They do not tell you what matters most. For that, we turned to the institutions' own answers.
Statistics Canada asked institutions which obstacles they face and, of those, which is the most important. Combining the two gives the share of institutions for which each obstacle is the single biggest problem. Ranking those shares is a Pareto analysis: it separates the few causes that account for most of the problem from the many that account for little.
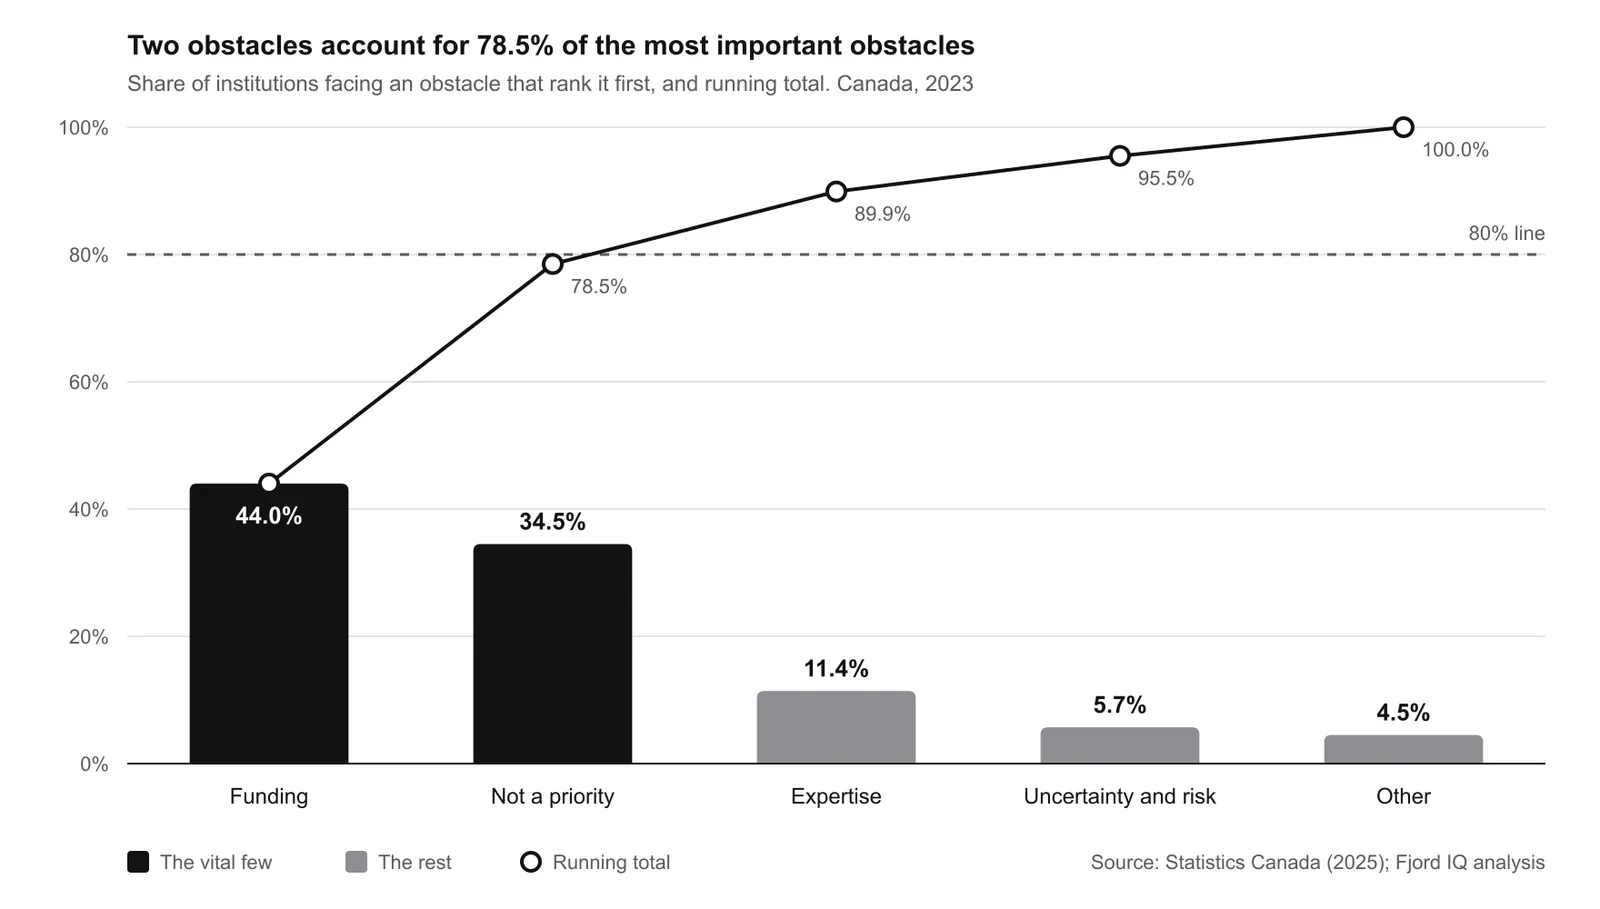
The result is stark. Lack of funding (44.0%) and lack of institutional priority (34.5%) together account for 78.5% of the most important obstacles, close to the classic 80% mark. Expertise adds 11.4%, uncertainty and risk 5.7%, and everything else 4.5%.
Nearly four in five institutions facing an obstacle say their biggest one is money or mandate.
Common Is Not the Same as Decisive
Here is the twist. Lack of expertise is cited almost as often as lack of priority, by half of all institutions. But only 19.7% of the institutions that cite it rank it first, compared with 57.2% for funding and 61.3% for priority.
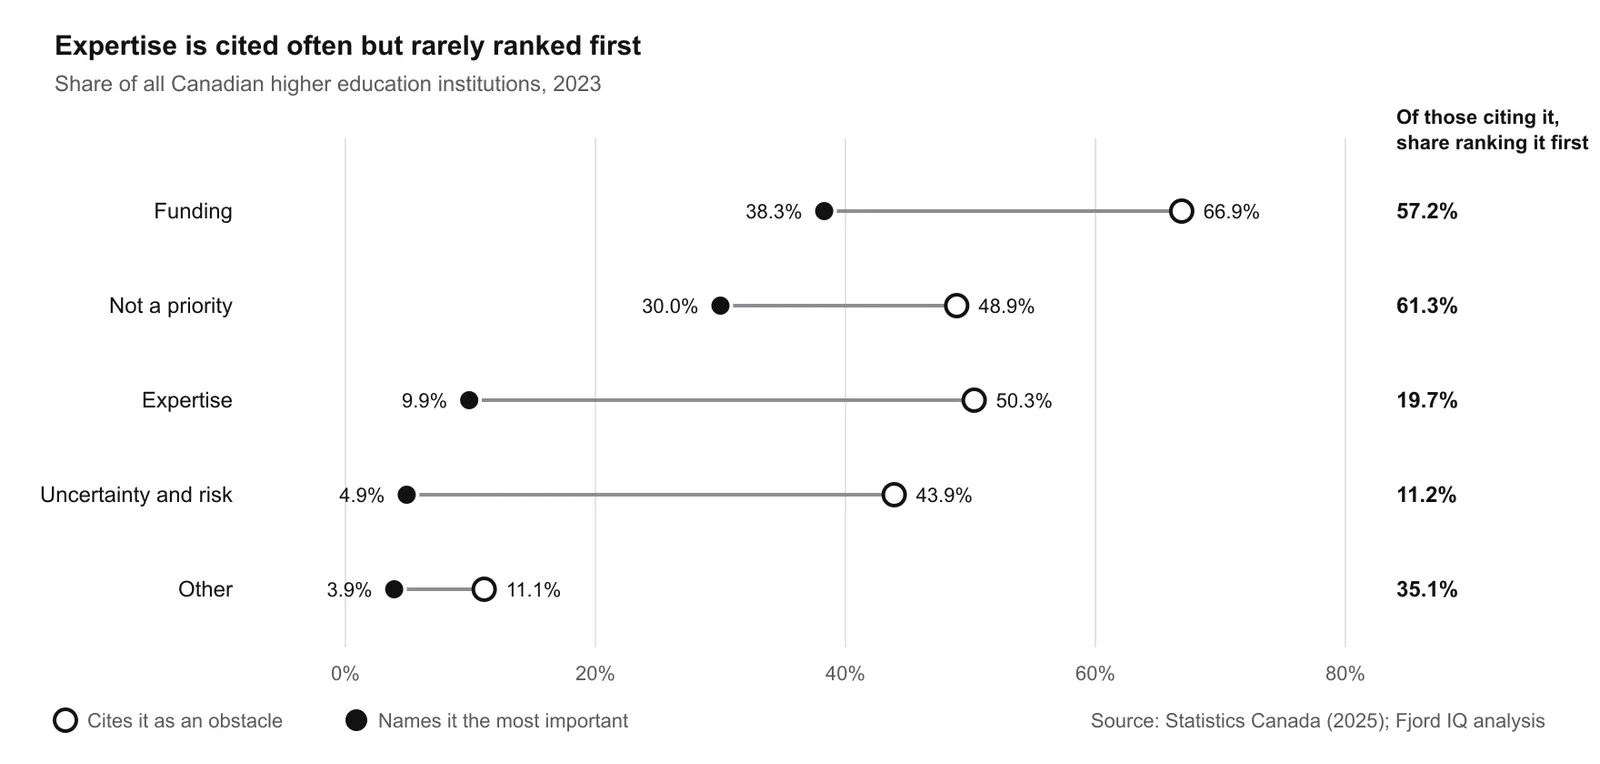
Expertise is a widespread concern, but rarely the thing holding a project back. Only 9.9% of all institutions name it as their most important obstacle, against 38.3% for funding and 30.0% for priority.
Not Every Institution Stalls the Same Way
The two big causes lead everywhere, but the mix changes by institution type.
| Most important obstacle | All | Universities | Research hospitals | Colleges and CEGEPs |
|---|---|---|---|---|
| Lack of funding | 44.0% | 46.5% | 49.2% | 36.1% |
| Not an institutional priority | 34.5% | 22.4% | 32.5% | 51.1% |
| Lack of expertise | 11.4% | 13.2% | 9.5% | 11.0% |
| Uncertainty and risk | 5.7% | 9.3% | 7.0% | 0.0% |
| Other | 4.5% | 8.6% | 1.9% | 1.9% |
| Top two combined | 78.5% | 68.9% | 81.7% | 87.2% |
- Research hospitals are the most concentrated: funding alone is the top obstacle for 49.2%, and funding plus priority reach 81.7%.
- Colleges and CEGEPs are the only group where priority beats funding, at 51.1%.
- Universities are the most spread out. Funding and priority reach 68.9%, and it takes expertise (13.2%) to pass 80%.
Capacity follows a similar pattern. Universities lead on every measure. Research hospitals, where much of Canada's clinical research happens, have the thinnest IP infrastructure of all.
| Share of institutions | All | Universities | Research hospitals | Colleges and CEGEPs |
|---|---|---|---|---|
| Engaged in IP management | 56.6% | 83.6% | 44.4% | 38.3% |
| Central office managing IP | 48.8% | 74.3% | 33.4% | 35.1% |
| Filed patent applications | 36.8% | 56.8% | 40.5% | 11.7% |
| Used incubators or accelerators | 28.0% | 41.3% | 22.7% | 18.5% |
| Used IP strategists | 11.0% | 16.3% | 3.1% | 12.5% |
Research hospitals face the most concentrated funding and priority problem and have the least infrastructure to act on IP once the money is found (Statistics Canada, 2025a).
What to Do About It
The data point to an order of action. These recommendations are our interpretation of the evidence.
- Close the bridge funding gap first. Funding is the top obstacle for the largest share of every institution type except colleges. Staged funding tied to milestones, such as the AUTM Canadian Public Policy Advisory Committee's proposal running from C$25,000 to C$75,000 validation grants up to translational seed investments of C$1 million (Crocco et al., n.d.), targets exactly where projects stall.
- Make commercialization an institutional priority. Priority is a governance choice. Institutions can count patents, licences and spinouts in tenure and promotion, share the career risk faculty now carry alone, and report outcomes next to publications. Provinces can build reporting frameworks like Ontario's into funding formulas.
- Treat expertise as a multiplier, not a substitute. Expertise pays off most when it comes attached to funding and a mandate, for example as a service built into seed fund milestones, rather than as a standalone fix.
- For health technology, plan regulation from day one. Classification, predicate and testing decisions made at the concept stage shape the cost of everything after. Building regulatory planning into proof of concept funding protects the money in step one.
- Measure the pipeline, not just participation. Public data are thin, and AUTM reporting in Canada is voluntary (Zhang, 2026b). Institutions that track time from disclosure to licence, the share of projects with funded proof of concept work, and regulatory readiness at disclosure will be able to show what works.
The Bottom Line
Canadian institutions are not short of research, or of awareness that commercialization is hard. Six documented causes stand between discovery and market, but institutions' own rankings point to two: money to bridge the gap between grant and investment, and a mandate that makes commercialization worth the effort. Fix those first, pair them with early expertise (especially regulatory expertise for health technology), and more publicly funded discovery will reach patients.
How We Did It
This analysis uses Statistics Canada's Survey on Research Activities and Commercialization of Intellectual Property in Higher Education, run with Innovation, Science and Economic Development Canada. Its first edition covers 2023 and is published as experimental estimates, revised on March 17, 2026 (Statistics Canada, 2026). For each obstacle, Statistics Canada reports the share of institutions citing it and, of those, the share rating it most important. Multiplying the two gives the share of all institutions for which that obstacle is the most important; dividing by the total gives each obstacle's share of top obstacles. These shares are our derivation, not published figures. They match the published totals for every institution type (for example 86.96% against the published 87.0% for all institutions). The causes on each branch come from an evidence register of 24 data points from peer reviewed studies, policy research and sector reports, compiled on October 14, 2026.
Limitations
- The Statistics Canada estimates are experimental and come from the survey's first edition; many research hospital and college values are graded B or lower.
- The survey's five obstacle categories are broad. Regulatory and market obstacles are not measured on their own, so they cannot be ranked directly.
- Several data points describe the United States or the United Kingdom, and two studies are older (2001 and 2011), though both remain standard references.
- Figures on different branches come from different populations and should not be compared with each other. The analysis is cross sectional and does not establish cause and effect.
Sources
- AUTM Canadian Public Policy Advisory Committee. (n.d.). Where do Canadian research innovations go? AUTM. Retrieved October 14, 2026.
- Crocco, F., Lal, S., & Rooney, C. (n.d.). Great research is only the start: Canada needs a bridge to market. AUTM Canadian Public Policy Advisory Committee. Retrieved October 14, 2026.
- Hendricusdottir, R., Hussain, A., Milnthorpe, W., & Bergmann, J. H. M. (2021). Lack of support in medical device regulation within academia. Prosthesis, 3(1), 1 to 8.
- Jensen, R., & Thursby, M. (2001). Proofs and prototypes for sale: The licensing of university inventions. American Economic Review, 91(1), 240 to 259.
- McIntyre, C. (2026, February 23). Canada's sluggish startup growth has cost its tech scene more than US$66B. The Logic.
- National Academy of Inventors. (2012, February 22). News release on the role of patents and commercialization in tenure and promotion. EurekAlert!
- Rose, L., McCaney, J., Dave, G., Brownley, K. A., Sheridan, D., Shah, P., Zapotoczny, G., & Espinoza, J. (2023). Software to manage regulatory workflows for medical device development at academic medical centers: A critical gap. Journal of Clinical and Translational Science, 7(1), e45.
- Shah, P., Snitman, A., McCaney, J., Rose, L. M., Sheridan, D., & Espinoza Salomon, J. (2023). PMDedu: Assessing the educational needs of startups and academic investigators focused on pediatric medical device development. Journal of Clinical and Translational Science.
- Statistics Canada. (2025a). Table 27-10-0406-01: Experimental estimates for intellectual property, intellectual property outputs and intellectual property management in Canadian higher education, by institution type. Revised March 17, 2026.
- Statistics Canada. (2025b). Table 27-10-0408-01: Experimental estimates for obstacles to commercialization of intellectual property in Canadian higher education, by type of institution. Revised March 17, 2026.
- Statistics Canada. (2026, March 17). Experimental estimates for the Survey on Research Activities and Commercialization of Intellectual Property in Higher Education, 2023. The Daily.
- Stevens, A. J., Johnson, G. A., & Sanberg, P. R. (2011). The role of patents and commercialization in the tenure and promotion process. Technology & Innovation, 13(3), 241 to 248.
- Zhang, L. (2026a, April 27). Canada's missing R&D firms. Information Technology and Innovation Foundation.
- Zhang, L. (2026b, July 20). Paying for outcomes: Tying university funding to commercial results. Information Technology and Innovation Foundation, Centre for Canadian Innovation and Competitiveness.
- Zou, B. (2025, January 15). U of T to host new national hub to advance life sciences breakthroughs. University of Toronto News.
About This Research
Fjord IQ is an AI native regulatory intelligence platform for medical technology and life sciences teams navigating FDA and Health Canada approval, built on the idea that regulatory knowledge should be a design input from day one rather than a late stage discovery. Disclosure: Fjord IQ provides regulatory intelligence software, which relates to the expertise and regulatory causes discussed here. The quantitative findings come from the public sources cited; the recommendations are the author's interpretation.